









The EU27 chemical industry, encompassing base, specialty, and consumer chemicals, is vital to the European economy, supplying diverse sectors and employing 1.2 million people. While specialty chemicals contribute significantly to sales, the industry faces challenges due to China’s dominance, holding 43% of global sales and driving the majority of investments from the global chemical industry. Europe’s market share on the global chemical market has continued to decline.
EU27 Efficient use of energy in the chemical industry
Energy consumption
-40%
1991-2023
Production growth
+28%
1991-2023
Energy intensity
-29%
1991-2023
Energy intensity (1,000 Gigawatt-hours)
Production index* (1991=100)
Specific energy consumption index* (1990=100)
| Year | Energy (GWh) | Prod. index | Spec. energy |
|---|---|---|---|
| 1991 | |||
| 1995 | |||
| 2000 | |||
| 2005 | |||
| 2010 | |||
| 2015 | |||
| 2016 | |||
| 2017 | |||
| 2018 | |||
| 2019 | |||
| 2020 | |||
| 2021 | |||
| 2022 | |||
| 2023 |
Source: Cefic analysis based on Eurostat data
*Specific energy consumption index is calculated as (energy consumption index / production index), 1991=100
*Specific energy consumption index is calculated as (energy consumption index / production index), 1991=100
Chemical sales in Europe by end market (2024)
Supplier to all key
manufacturing sectors
manufacturing sectors
Sales (2024)
€635 billion
1.
Manufacturing/Industrial
31%
2.
Pharmaceutical/Health
11%
3.
Automotive/Transportation
11%
4.
Construction
11%
5.
Agriculture/Food
9%
6.
Consumer products
6%
7.
Packaging
4%
8.
Textile and apparel
3%
9.
Electronics/Appliances
2%
10.
Pulp and paper
1%
11.
Water treatment
1%
12.
Others
10%
1.
Manufacturing/Industrial
Chemicals for machines, equipment & industrial processes
31%
2.
Pharmaceutical/Health
Active ingredients, excipients & medical materials
11%
3.
Automotive/Transportation
Coatings, lubricants, plastics & rubber
11%
4.
Construction
Adhesives, sealants, insulation & paints
11%
5.
Agriculture/Food
Crop protection, fertilisers & food additives
9%
6.
Consumer products
Detergents, cosmetics & personal care
6%
7.
Packaging
Films, resins & functional coatings
4%
8.
Textile and apparel
Dyes, finishing agents & synthetic fibres
3%
9.
Electronics/Appliances
Specialty chemicals, semiconductors & displays
2%
10.
Pulp and paper
Bleaching agents & coating chemicals
1%
11.
Water treatment
Coagulants, biocides & pH regulators
1%
12.
Others
All remaining end-use markets
10%
Source: Advancy analysis based on Cefic, Eurostat, Oxford Economics
Europe is the second largest chemicals producer in the world
World chemical sales 2023, €5,195 billion
Evolution of chemicals sales (2004 vs 2024)
China overtakes Europe
and the US as global
leader in chemical sales
and the US as global
leader in chemical sales
EU 2004
27%
EU 2024
13%
Sales market share
2004
2024
| Region | 2004 share | 2024 share | Change |
|---|---|---|---|
| USA | 22% | 12% | -10pp |
| EU27 | 27% | 13% | -14pp |
| Rest of Europe* | 7% | 4% | -3pp |
| China | 10% | 46% | +36pp |
| Japan | 9% | 3% | -6pp |
| South Korea | 3% | 3% | 0pp |
| India | 2% | 3% | +1pp |
| Rest of Asia** | 9% | 10% | +1pp |
| Latin America | 4% | 3% | -1pp |
| Rest of world | 6% | 3% | -3pp |
Source: Cefic Chemdata International
* Rest of Europe covers UK, Switzerland, Norway, Turkiye, Russia and Ukraine
** Asia excluding China, India, Japan and South Korea
* Rest of Europe covers UK, Switzerland, Norway, Turkiye, Russia and Ukraine
** Asia excluding China, India, Japan and South Korea
EU27 market share dropped significantly in 10 years
World chemical sales by comparaison: top 10 countries
EU27 Efficient use of energy in the chemical industry
Energy consumption
-40%
1991-2023
Production growth
+28%
1991-2023
Energy intensity
-29%
1991-2023
Energy intensity (1,000 Gigawatt-hours)
Production index* (1991=100)
Specific energy consumption index* (1990=100)
| Year | Energy (GWh) | Prod. index | Spec. energy |
|---|---|---|---|
| 1991 | |||
| 1995 | |||
| 2000 | |||
| 2005 | |||
| 2010 | |||
| 2015 | |||
| 2016 | |||
| 2017 | |||
| 2018 | |||
| 2019 | |||
| 2020 | |||
| 2021 | |||
| 2022 | |||
| 2023 |
Source: Cefic analysis based on Eurostat data
*Specific energy consumption index is calculated as (energy consumption index / production index), 1991=100
*Specific energy consumption index is calculated as (energy consumption index / production index), 1991=100
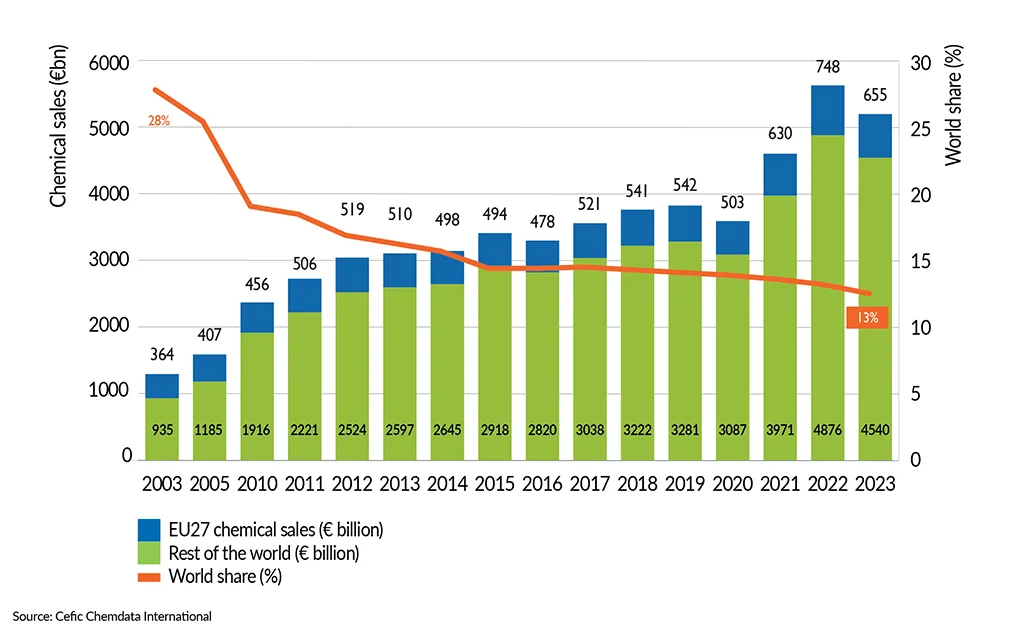
Over 20 years, the EU27 share of global chemical Market dropped
EU27 share of global chemical market
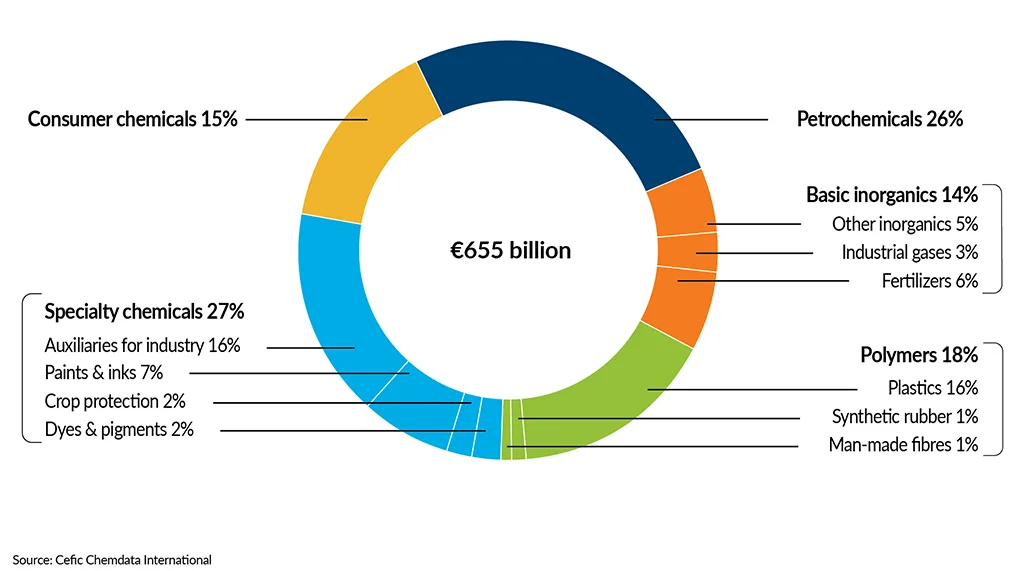
Petrochemicals and specialties account for more than half of EU27 chemical sales
EU27 chemical sales 2023 (€655 billion)
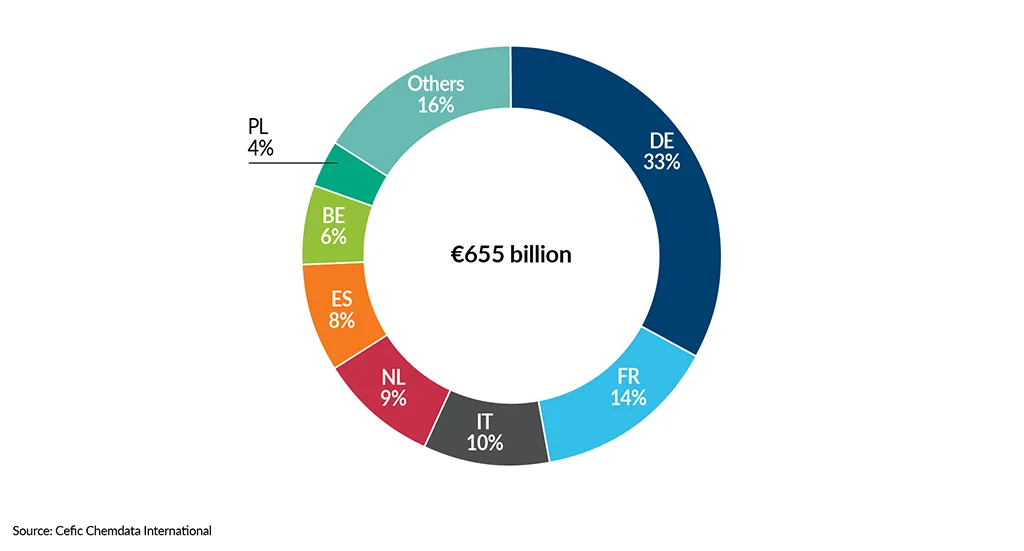
Two thirds of EU27 chemical sales generated in four Member States
EU27 chemical sales broken down by country (2023)
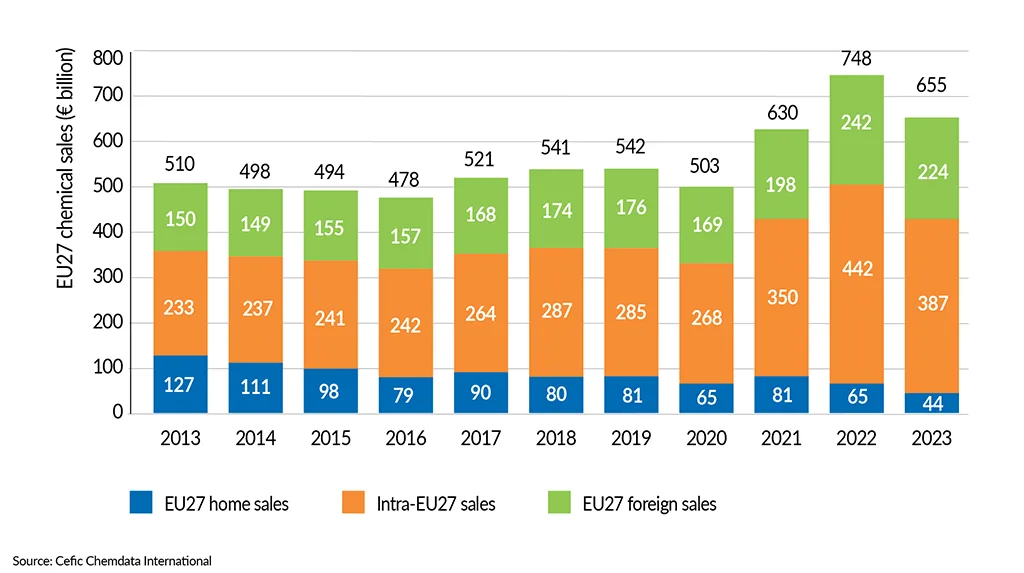
EU27 chemical sales significantly decreased in 2023 vs 2022
EU27 chemical sales structure (€ billion)
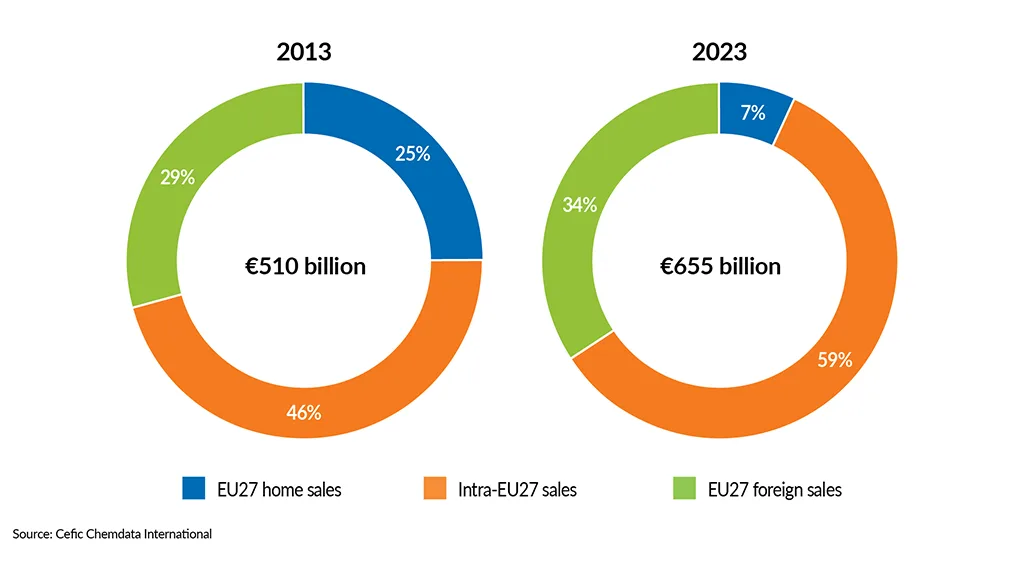
One third of EU27 chemical sales is generated from exports
EU27 chemical sales structure (%)
More than half of EU chemicals are supplied to the industry
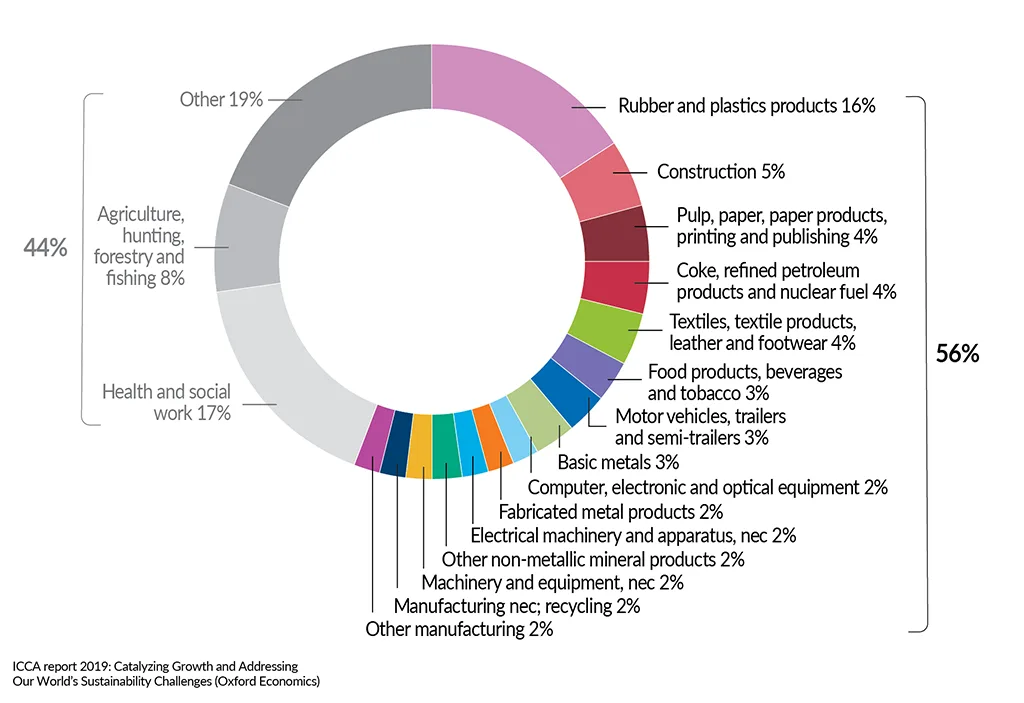
Customer sectors of the EU27+UK chemical industry (2017)